

The Most Expensive Question in Renewal Season: "Are We Paying the Right Rate?"
A provider contract is coming up for renewal. The provider arrives asking for an increase, and the contracting team opens its files. The team knows what the plan pays today, what it paid in prior years, how much utilization flows through the provider, and perhaps how that provider performs on quality and cost.
One piece is often still missing: how does our reimbursement compare with what competing health plans pay this provider, and providers like it, in the same market?
Teams should have that answer long before renewal conversations start, and the cost of guessing keeps rising. PwC's Health Research Institute projects group medical cost trend of 8.5% for 2026, the same elevated level as 2025. Public standoffs between payers and providers are climbing too. FTI Consulting counted 171 publicly reported payer-provider disputes in 2025, up from 86 in 2023.
The thesis of this article is simple. The most valuable payer rate analysis is the intelligence a plan has before it needs it.
Renewals also rarely arrive one at a time. A regional plan may carry hundreds of facilities and professional agreements with staggered dates, and many cluster around January 1. When analysis starts only after a provider's notice letter arrives, the plan is working on the provider's timeline.
Price transparency rules have given the industry far more visibility into negotiated prices than it had five years ago. Those massive files still leave a health plan without a clear view of where its own network sits competitively. The harder work now lies in turning that data into intelligence early enough to change the outcome of the next negotiation.
Price Transparency Closed One Information Gap and Opened Another
Under the Transparency in Coverage rule, payers have posted in-network negotiated rates in machine-readable files since July 2022, and hospitals publish payer-specific negotiated charges under a separate rule. Federal attention rose again when a February 2025 executive order called for stronger price transparency enforcement.
Visibility has improved faster than usability. A November 2025 study in Health Affairs Scholar reviewed files from 61 insurers and found the median insurer's data was 84.3% ghost rates, meaning prices listed for services a provider almost certainly never performs. When Georgia's all-payer claims database team matched 2.9 billion published rates against 2024 and 2025 claims, 97.65% had no corresponding claims activity. Hospital files have their own gaps: Another study found only 21.1% of 2,000 reviewed hospitals were fully compliant in its November 2024 report. Regulators have noticed. Rules proposed in December 2025 would require plans to drop rates for services a provider is unlikely to bill given its specialty.
The result is data abundance without decision context. A network manager may have access to rates across payers, providers, geographies, procedure codes, facilities, reimbursement arrangements and products. Access alone leaves the questions that shape a renewal unanswered:
- Which of our rates are out of position?
- Against which competitors, and in which market?
- By how much?
- Is the difference large enough to act on?
Those answers come from turning healthcare rate comparison information into network intelligence. That conversion step is where most of the value sits, and price transparency data on its own rarely gets a plan there.
Why a National Benchmark Falls Short: Healthcare Pricing is Local
A rate can look favorable against a national average and still be uncompetitive in the market that matters. Provider contracting happens inside local competitive dynamics, so the useful question is how a rate compares with relevant providers and competing health plans in the same geography.
The evidence for local variation is strong. RAND's hospital price study found employers and private plans paid an average of 254% of Medicare prices in 2022, with some states below 200% and others above 300%. The spread inside a single city can be just as wide. RAND researchers pointed to one hospital paid about three times Medicare and another in the same city, with the same quality rating, paid about two times. A Congressional Research Service report published in June 2025 found negotiated rates for one procedure at one hospital ranging from $14,306 to $56,695 depending on the insurer, a fourfold difference.
Market structure explains much of this. RAND found that 18% of the variation in hospital relative prices traced to market share. On the payer side, another study found market-leading insurers in the most concentrated markets paid hospitals 15% less than market leaders in the most competitive ones.
Product line adds another layer. A plan's commercial PPO, its Medicare Advantage HMO and its exchange product may contract with the same health system at different rates, and each product competes against a different set of rivals. Medicare Advantage contracts have become a frequent flash point: 42 of the 76 disputes FTI tracked in the fourth quarter of 2025 involved Medicare Advantage plans.
Geography matters because so many inputs shift from one market to the next: provider supply, market concentration, specialty availability, network penetration, competitive payer presence and referral patterns. Useful payer rate analysis requires that market context, and a giant national rate table cannot supply it.
Think of it as a progression. A rate is a number. A benchmark creates comparison. Competitive benchmarking within the right geography creates strategic context.
The Real Gap is When You Discover It
Imagine learning three months into a negotiation that a material service category is priced well apart from relevant market comparators. Or that a competitor holds a very different reimbursement position with the same provider group. Or that a handful of providers account for a disproportionate share of cost, and the requested increase would widen an existing gap. None of that intelligence is useless. It simply arrives late.
Call this the pre-renewal intelligence gap. Timing makes it expensive. FTI notes that the fourth quarter consistently produces the most disputes because many contract termination dates line up with the calendar year. In the fourth quarter of 2025 alone, FTI tracked 76 disputes, and 22 ended in contract terminations.
Late intelligence also hands the agenda to the other side. Health systems now use the same public files to build their own case, and some executives say openly that transparency data helps them show when a payer under-reimburses. If the provider arrives with a finished analysis and the plan is still assembling its own, the provider frames the opening position.
Most contracting teams still work in a reactive sequence:
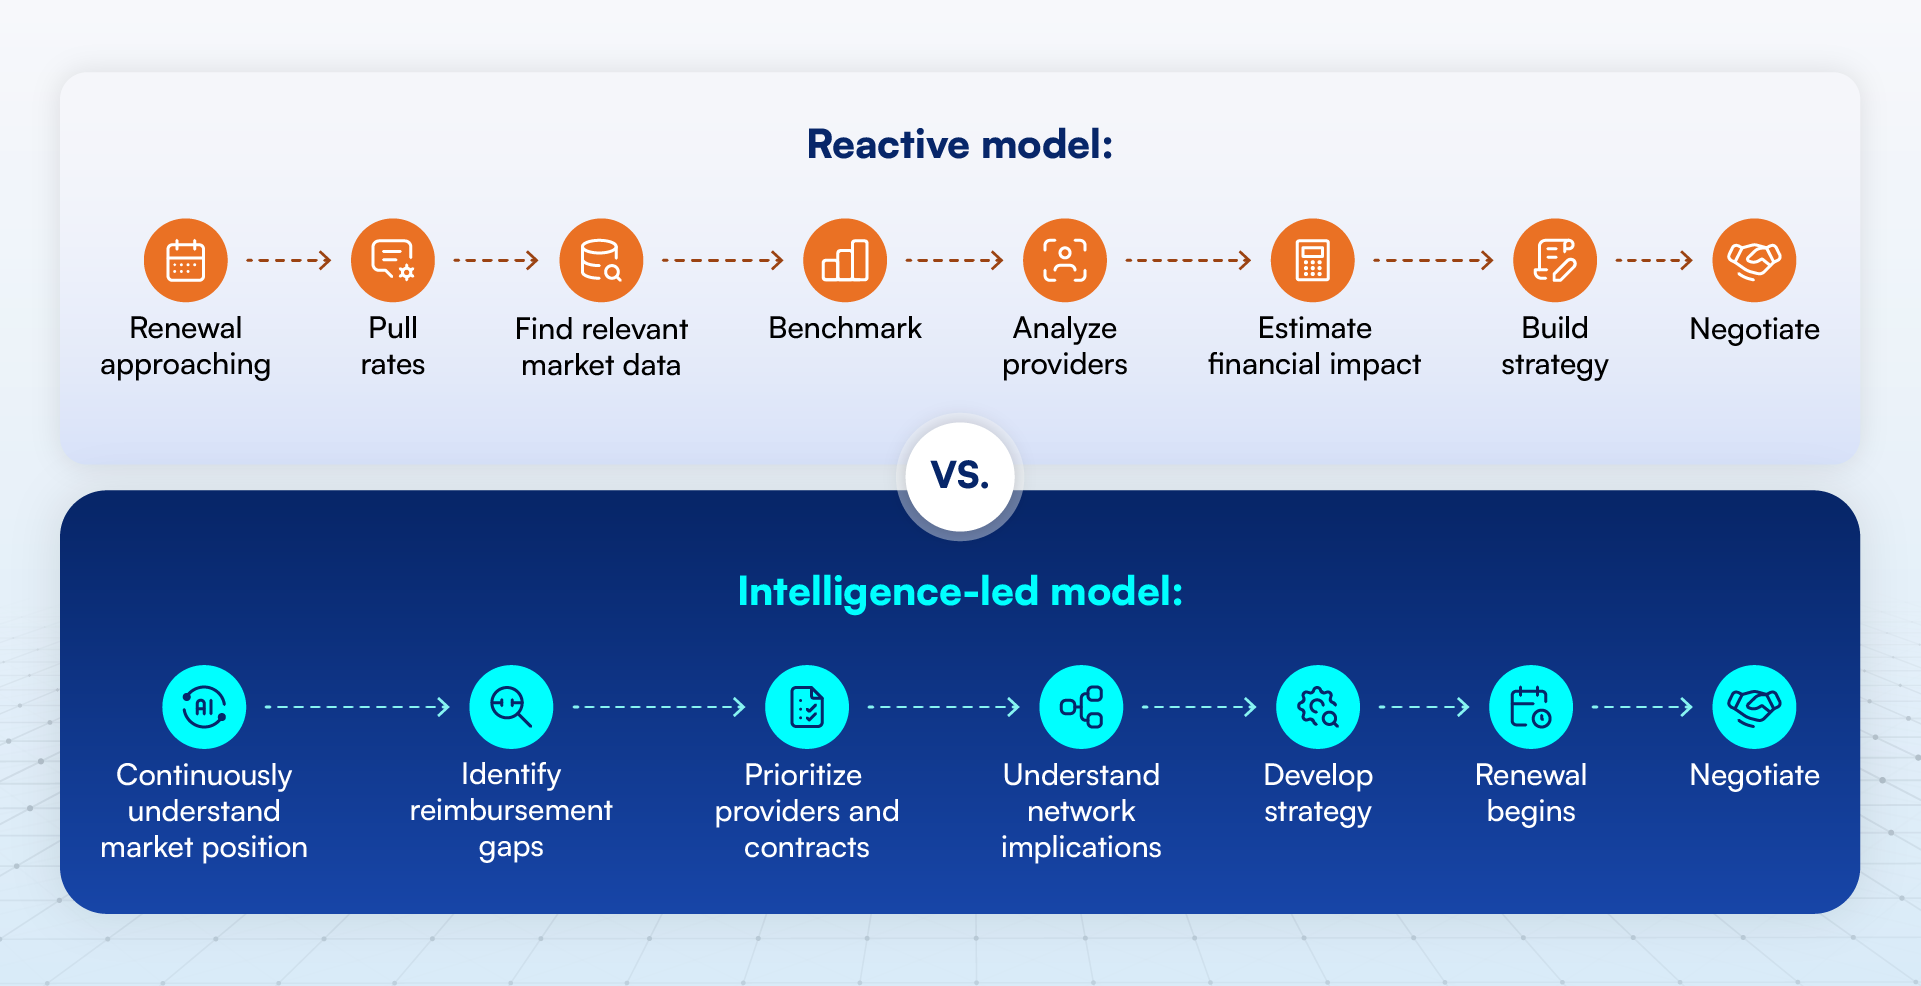
In the first model, every analytical step competes with the negotiation clock. In the second, the analysis is finished before the clock starts.

Healthcare Rate Comparison Should Answer More Than "Above or Below Average?"
Good payer rate analysis answers four questions, and each one is worth more than the last.
Question 1: What are we paying?
This is basic internal visibility. Every plan needs it, and on its own it says nothing about competitive position.
Question 2: How does it compare?
Comparison against relevant external reimbursement data shows relative position for the first time.
Question 3: Who should we compare ourselves against?
The benchmark has to reflect the competitive environment where the network actually operates. That means geography-specific payer and provider comparisons, filtered down to rates that reflect services providers really deliver.
Question 4: What should we do about it?
This is the real objective. A difference between two rates does not automatically signal a negotiation opportunity. The plan also needs context on provider performance, utilization, cost, network penetration, geography, member needs, network adequacy and potential disruption.
Most pricing tools stop at the second question. The third and fourth questions are where payer competitive intelligence starts to earn its keep.
How NetworkIQ Turns Rate Benchmarking into Pre-Renewal Intelligence
Healthcare rate comparison become far more useful when they sit inside network intelligence. That is the design principle behind MCheck® NetworkIQ, HiLabs' network management application for health plans. Four capabilities matter most for renewal preparation.
1. Benchmark against the market that matters
NetworkIQ's Reimbursement Reconciliation capability benchmarks reimbursement against geography-specific competitors and providers to surface negotiation opportunities. This addresses the local-market problem directly. A contracting team moves from "we pay $X" to "we pay $X, here is our position in this market, and here is the size of the gap."
2. See payer-versus-payer competitive position
Reimbursement benchmarking health plans provides payer-versus-payer comparisons on provider penetration and product and network design. A competitor's reimbursement position becomes strategically useful once you understand how that competitor is positioned with the same providers in the same market. A higher rate paired with deep penetration tells a different story from a higher rate paired with a thin network.
3. Put reimbursement alongside cost and utilization
The Cost of Care Compass combines a provider's cost-of-care index with utilization. Its network steerage capabilities bring together clinical, member, claims and pricing data for broader provider performance evaluation. Rate comparison shows where a difference exists. Network intelligence shows whether that difference matters.
4. Understand the consequences of network change
It includes disruption forecasting that identifies the drivers and financial implications of provider turnover, contract termination and reimbursement negotiations relative to competitors. With 22 fourth-quarter disputes in 2025 ending in termination, understanding the downstream effect of a hard negotiating position before taking it is a practical requirement.
The data foundation matters as much as the analytics. Benchmarks built on unresolved provider identities, outdated affiliations or ghost rates point teams at the wrong targets. NetworkIQ (NIQ) builds on provider data accuracy work, including its approach to identifying ghost providers, so the comparison reflects providers who actually practice where the network says they do.
Together, these capabilities take the work well past a database of competitor prices. Contracting and network teams get one view of position, performance and consequence.

Not every rate gap is a negotiation opportunity
Suppose NIQ surfaces two providers whose reimbursement sits above a relevant benchmark.
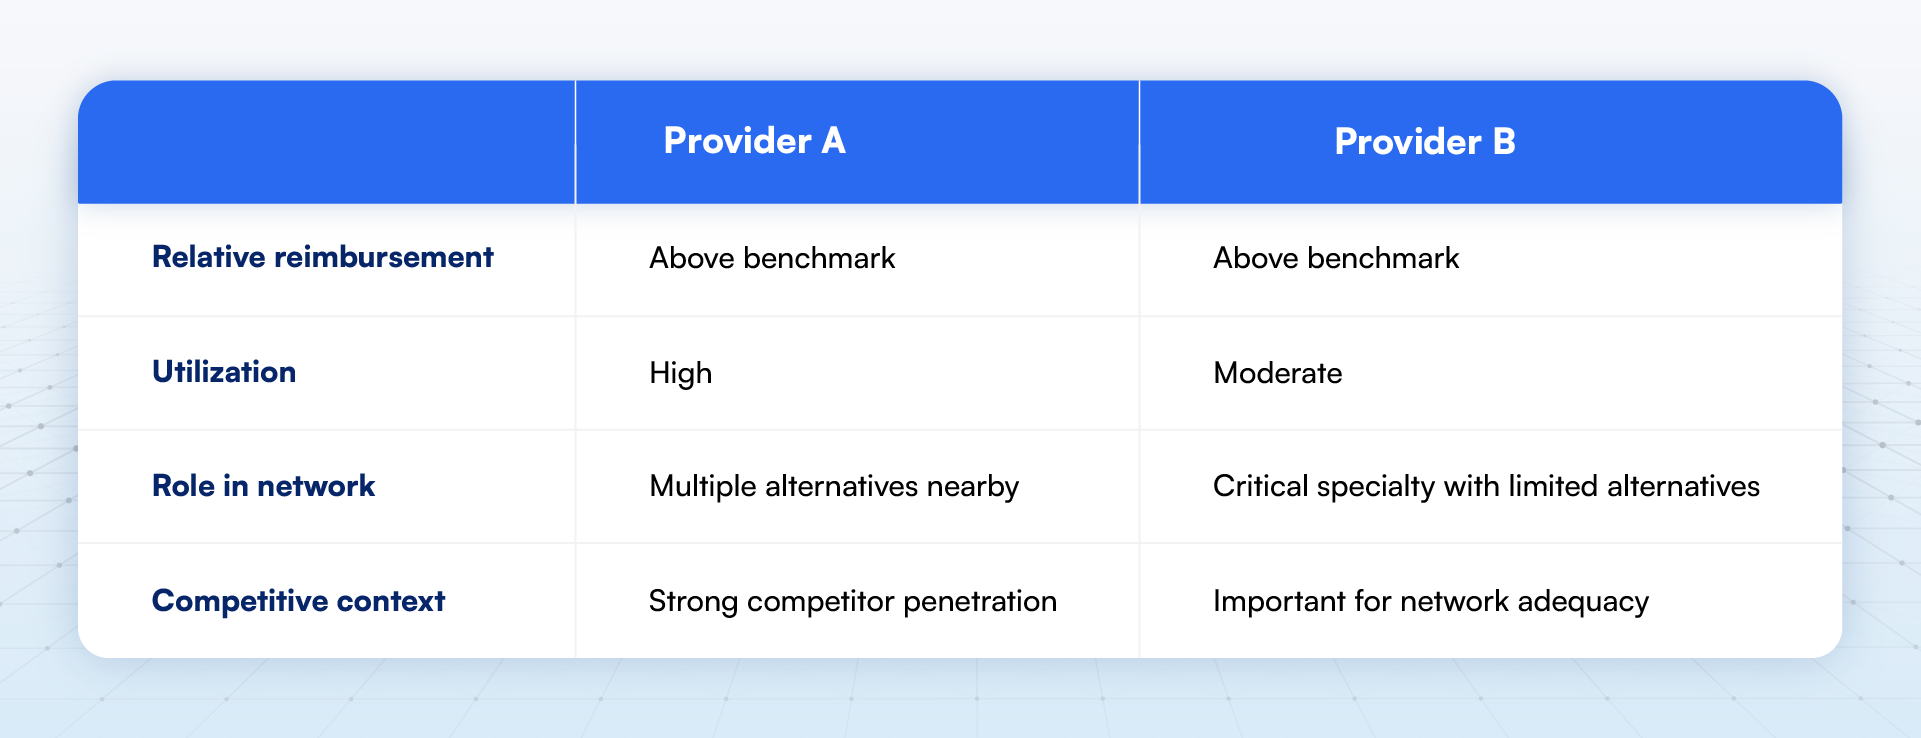
The rate signal is the same. The network decision is completely different. Provider A may be a strong renegotiation candidate. Pushing hard on Provider B could create access gaps, adequacy exposure and member disruption that cost more than the rate difference saves.
Adequacy rules raise the stakes further. Losing a provider in a specialty with few alternatives can put time and distance standards at risk, which turns a pricing decision into a compliance question.
This is why benchmarking belongs inside network intelligence, and why it fits naturally in a network management platform. NIQ is framed around three connected objectives: compliance, competitiveness and cost of care. Reimbursement comparison sits squarely inside the second and third.
The Pre-Renewal Playbook: Turning Rate Intelligence into Action
180 days before renewal: Understand Position. Benchmark reimbursement against relevant geography-specific competitors and providers. Flag meaningful discrepancies and screen out rates for services the provider does not actually deliver.
120 days: Prioritize. Overlay rate position with utilization, provider performance, network importance, competitive position and cost of care. Separate interesting differences from material opportunities.
90 days: Assess Network Implications. Ask what happens if the relationship changes, whether alternative providers are available, whether member access could be affected, and where the provider sits within the broader network.
60 days: Build The Negotiation Fact Base. Contracting and network teams enter preparation with current rate position, relevant market comparisons, provider and network context, cost and utilization intelligence, and potential network implications.
Renewal: Execute The Strategy. The team starts provider contract negotiations already knowing where the plan stands. The working question shifts from "what does the market look like?" to "what position do we want to hold?"
The playbook works best when ownership is clear. Network analytics often owns the 180-day benchmark, network management and medical economics share prioritization, and contracting leads the fact base. When every group works from the same view of position and performance, those handoffs move faster.
From Annual Review to Continuous Competitive Intelligence
Rate review should run all year, and so should network benchmarking. Networks change constantly: providers enter and leave, competitors expand, reimbursement shifts, utilization moves, member populations change and referral patterns evolve. Regulators expect that movement to be tracked. The December 2025 proposal would also require plans to publish a change log file showing what changed between versions of their rate files.
In practice, continuous monitoring comes down to a short list of triggers: a competitor adding or dropping a major health system, a physician group joining a larger system, a sustained shift in utilization for a high-cost service line, or new rate files that move a provider's relative position. Each one is a reason to revisit a contract well before its renewal date.
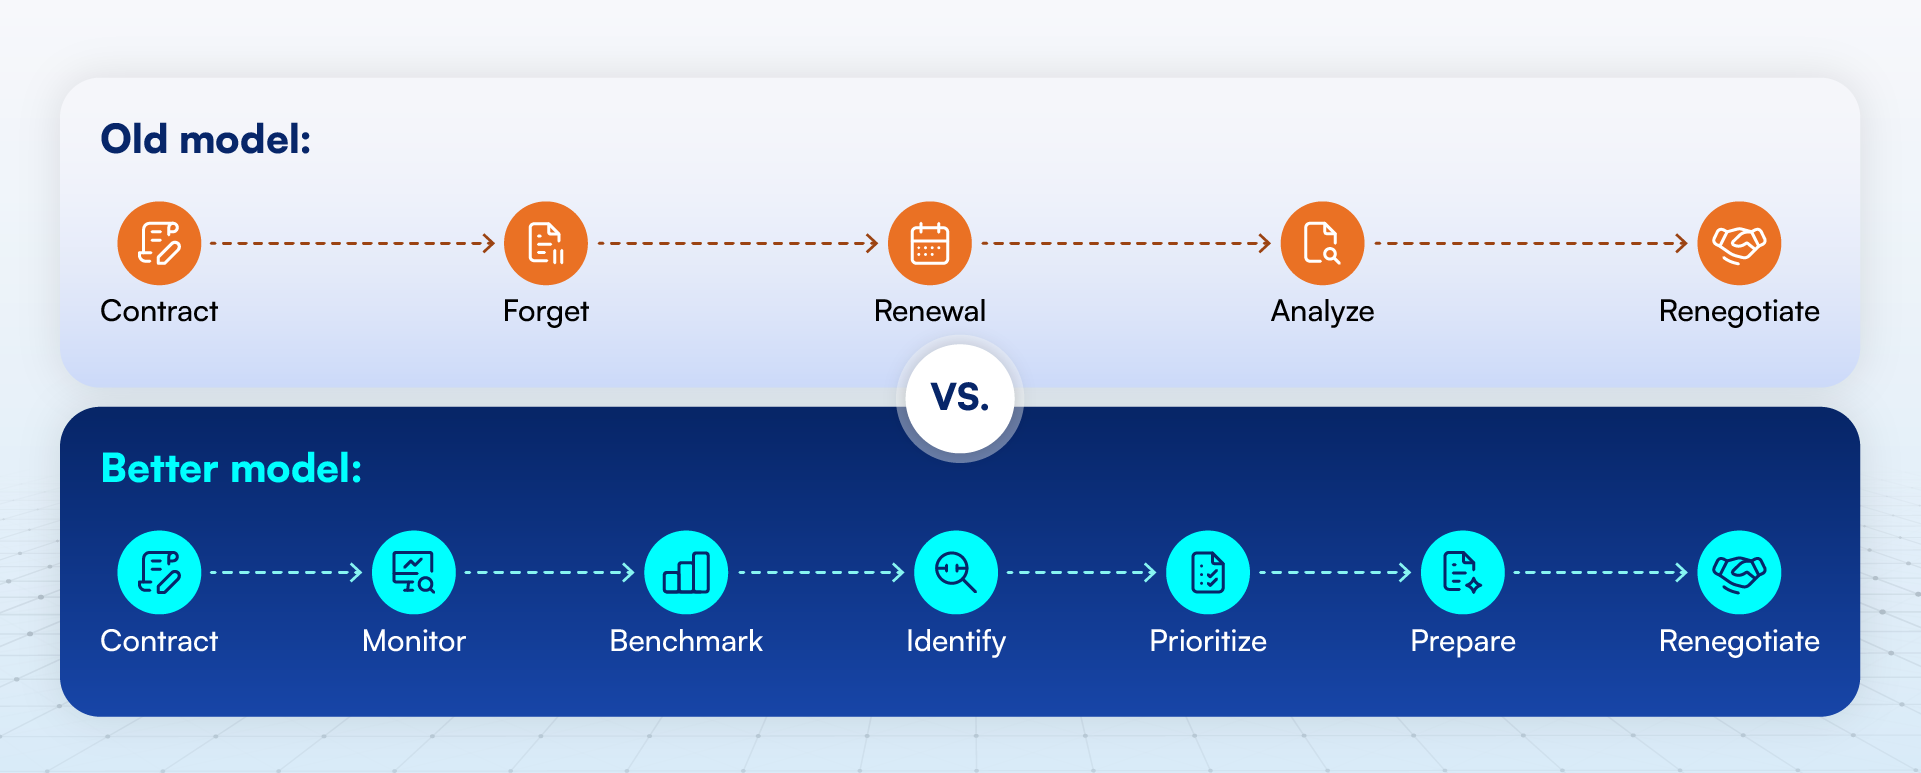
This matches NIQ's broader purpose of moving health plans from point-in-time network management toward continuous intelligence. NIQ integrates multiple provider data sources and supports ongoing competitive, adequacy, cost and performance analysis in one application, so teams can stop running each as an isolated workflow.
Conclusion: Find the Gap Before Renewal Season Finds You
Back to the opening question. Before the next negotiation, health plans need clear answers on four points: where they are competitively positioned, where the meaningful reimbursement gaps are, which of those gaps matter, and where their teams should focus first.
NIQ brings competitive rate benchmarking into the broader context of provider performance, network penetration, utilization, cost and network dynamics. It helps health plans turn price transparency data into intelligence they can act on before renewal pressure sets in.
The best time to find a reimbursement gap is months before anyone sits down at the negotiating table.